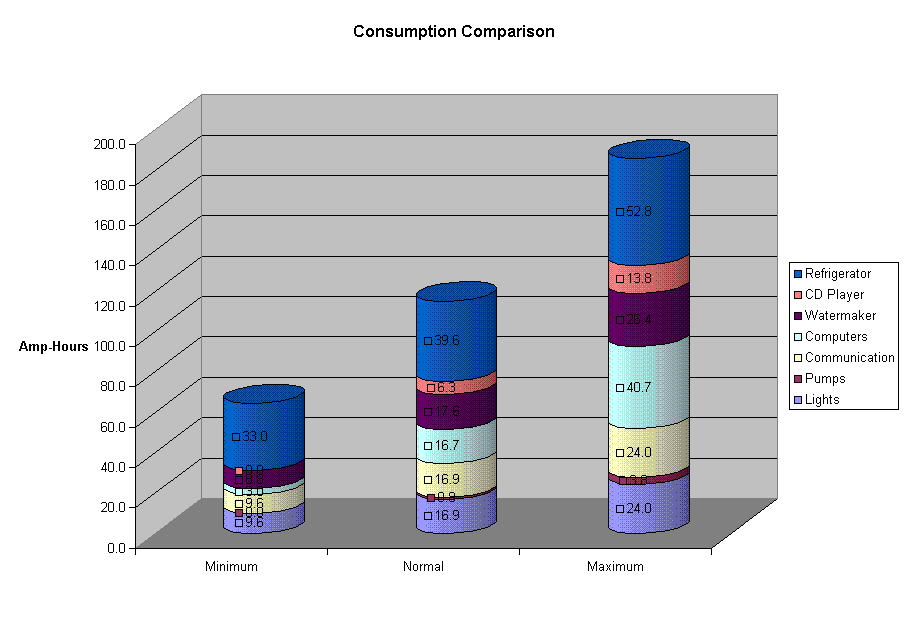


The columns represent the sum total of expected consumption under minimum (tightest restriction,) normal, and maximum (greatest usage) conditions. The bands or color on each stand for the various categories, shown on the legend to the right. Although most items are listed by their greater group, 'Other' was split up because two of its components have very noteworthy consumption in their own rights. In addition to displaying the differences between the three levels, and the portions that each makes up, this graph shows how the proportions of each category change by consumption level. The CD Player, for example, is unneeded, and would therefore be hardly if ever used under minimum consumption. However, in a long day of work it may be on for most of our waking hours, and account for more than an 8th of the day's usage. The fridge, on the other hand, changes very little relative to itself, making it a big part of the minimum, and a (relatively) small part of the maximum.
It should be noted that the second column, normal daily consumption, is shown in percentage form in the consumption pie.
Top Level: Home | Destinations | Cruising Info | Underwater | Boat Guests | Ocelot | Sue | Jon | Amanda | Chris | Site Map | Make a Comment
|
If our information is useful, you can help by making a donation |
Copyright © 2000‑ Contact: Jon and Sue Hacking -- HackingFamily.com, svOcelot.com. All rights reserved.